System Z is designed to efficiently run multiple different workloads at the same time. From Linux you can with proper authorization monitor the other LPARs. The tool for this is hyptop.
Hyptop is documented in the man page (“man hyptop” in your system) as well as in “LPAR and z/VM guest: Device Drivers, Features, and Commands” (Reference –> Commands –> hyptop). There are two modes supported – interactive mode and batch mode. Use the interactive mode for a quick look and the batch mode for long time monitoring. It will work under any supported hypervisor.
The prerequisites for hyptop are:
- Ensure that debugfs is mounted correctly and /sys/kernel/debug/s390_hypfs is available
- For being able to see other LPARs you needs to set in the LPAR security profile also the “Global performance data control” checkbox
- For being able to see other z/VM guests, you need that userID to be class B
Starting hyptop in an LPAR produces in interactive mode an output like
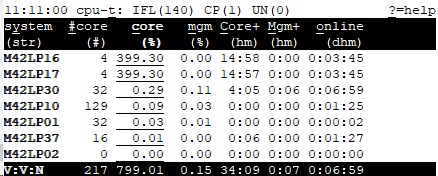
For monitoring in batch mode in LPAR I usually use the following command line:hyptop -b -d 60 -n 1440 -f \#,T,c,e,m,C:s,E:s,M:s,o -S c
- -b : batch mode
- -d 60: delay 60s between reads
- -n 1440: 24*60: one readout every minute for the whole day
- -f \#,T,c,e,m,C:s,E:s,M:s,o : read every field, format some as in seconds
- -S c : sort by “core %” field
You can then pipe this into a file e.g. /var/log/hyptop-<currentdate>.txt or do any other processing you want with it.
If the Linux runs as second level guest under z/VM or KVM, then there is no thread information available. So the command line then is:hyptop -b -d 60 -n 1440 -f \#,c,m,C:s,M:s,o -S c